2024 · Case study
GTFS Difference
A local Flask tool that diffs two public GTFS zips — routes, stops, service, calendar, transfers, and fares — then draws the changes on an OSM map and writes an Excel workbook.
VIA Metropolitan Transit publishes these GTFS feeds as public data. This page shows one comparison: May 2026_20260728 (2026-05-04 – 2026-08-23) versus August 2026_20260904 (2026-08-24 – 2027-01-10). The local app is not on GitHub.
Executive Summary
A new GTFS zip is not a change log. Routes.txt, stops.txt, trips.txt, and shapes.txt all move at once, and the interesting story is usually a mix of a dropped lineup, a handful of relocated stops, and a few dozen routes whose trip counts or alignments shifted. GTFS Difference takes two public zips, indexes each feed, and writes a status on every route, stop, service row, calendar service, transfer, and fare. Stops that move at least 15 meters are called out separately from simple attribute edits. The local viewer draws Feed A dashed and Feed B solid on OpenStreetMap and downloads an Excel workbook with the same tables. This page embeds the May 2026 versus August 2026 VIA Metropolitan Transit comparison.
- Problem
- Each new GTFS publish is a zip of tables. Planners need to see what actually changed — dropped routes, moved stops, new trips — without opening two feeds side by side in a spreadsheet.
- Who
- Service planning, scheduling, and GIS staff who review a new published feed before it goes live.
- Solution
- A command-prompt picker loads two GTFS zips, pandas compares the tables, and a local Flask page shows an OSM map, filterable tables, and an Excel download.
- Outcome
- On the published May vs August 2026 VIA pair: 3 route diffs, 22 stop diffs, 43 service diffs, and 32 routes with stop-pattern or alignment changes, including the removal of route 251.
Business Problem
Background
Transit agencies republish GTFS on a regular calendar. The files are public, but the delta is not. Opening two zips in Excel misses geometry, and a GIS-only overlay misses trip counts, first-last times, and fare tables. The job was a repeatable local tool: pick two feeds, wait for the compare, and leave with a map plus a workbook a planner can filter.
Challenges
- A route can keep the same id while its color, trip count, stop list, or shape changes
- Stops are added, removed, or relocated a few meters — those are different operational stories
- Service lives across trips, stop_times, calendar, and calendar_dates, not in one table
- Shapes are dense polylines; the map needs a simplified line, not every shape point
- Feed choice belongs at the command prompt so the browser stays a viewer, not a file uploader
Stakeholders
- Service planners reviewing what the next published feed actually changes
- Schedulers checking trip counts, spans, and destination signs
- GIS users who want the alignment overlay on a street map
Success criteria
- One command to pick two local GTFS zips and open a comparison
- Status on routes, stops, service, calendar, transfers, and fares — not only geometry
- Stops moved at least 15 m called out separately from attribute-only edits
- OSM map with Feed A dashed / Feed B solid, plus an Excel download of the same tables
Solution Architecture
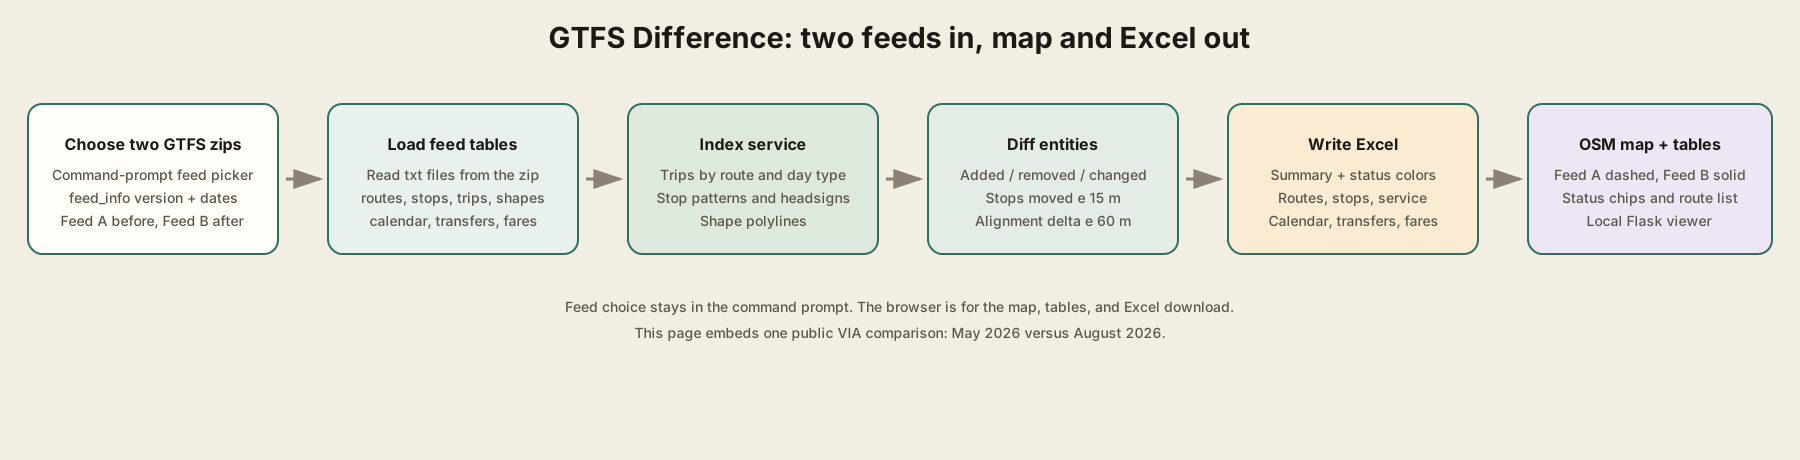
Data sources
- Caller-supplied GTFS zip files in a local GTFS folder (standard txt tables at the zip root)
- VIA Metropolitan Transit public feeds used for the published comparison on this page
Stack
Design decisions
Why a command-prompt picker instead of a browser upload? The zips can be large, and feed identity already lives in feed_info.txt. The prompt lists every zip with version and date range, refuses the same file twice, then starts Flask as a read-only viewer.
Why 15 m for a moved stop? GTFS coordinates jitter. A few meters is usually a geocode refresh; 15 m is large enough to treat as a real relocate and draw a move line on the map.
Why Flask plus Excel instead of a notebook? The compare is the product: a status-colored workbook for email and a map for overlay. Flask serves one in-memory result; OpenPyXL writes the same tables to disk.
Data Modeling
Business metrics
- Route / stop / service diffs
- Rows whose status is not unchanged. This run: 3 route diffs, 22 stop diffs, 43 service diffs.
- Moved stop
- Same stop_id in both feeds whose haversine distance is at least 15 meters. This run: 3 stops (85 m, 19.8 m, 70 m).
- Stop-pattern or alignment change
- A route that gained or lost stops, or whose shape shifted at least 60 meters. This run: 32 routes.
Governance
- Feeds are compared as published; the tool does not rewrite agency files
- Unchanged rows stay in the Excel routes sheet so a full inventory is still available
- The map snapshot on this page keeps only non-unchanged geometries so the file stays small
- Agency, feed version, and service dates travel with the result (VIA Metropolitan Transit on this run)
How a GTFS delta is structured
These are comparison rules, not a ridership model.
Attribute change and service change are separate. Route 62 and 89 only changed route_color in routes.txt, but their service rows also show large weekday trip increases. The map status combines both so a color-only edit and a trip-count edit do not look the same.
Moved is not removed-plus-added. A stop that keeps its id and shifts 15 m or more is marked moved, with a dashed line from the old coordinate to the new one.
Calendar turnover is expected. Weekday, Saturday, and Sunday service_ids rolled from 340.* to 342.* because the feed window moved from May–August to August–January. That is a calendar change, not a new network.
Missing tables are a finding. Fare tables appear only in the August feed (four fare_ids, including $1.30 and $2.60). The compare reports them as added rather than ignoring an empty left table.
Pipeline & Engineering
Ingestion
- List every .zip in the GTFS folder and peek at feed_info.txt for version and date range
- Read standard GTFS txt tables from each zip (agency, routes, stops, trips, stop_times, shapes, calendar, calendar_dates, transfers, fares)
- Normalize column names and string values so a blank cell compares as empty, not NaN
Transformations
- Index trips by route and day type; attach the dominant shape and destination sign per direction
- Diff route and stop attributes; flag stops that move at least 15 m
- Diff trip counts, first/last departure, stop lists, headsigns, and shape alignment (60 m threshold)
- Diff calendar windows, exception dates, transfers, and fare attributes
Automation
- run.bat or python app.py creates the venv on first run and installs Flask, pandas, and openpyxl
- The compare runs once in the command window; Flask serves that in-memory result at 127.0.0.1:5050
- Excel is written to the output folder when downloaded from the page
Python · Read each GTFS table from inside the zip
with zipfile.ZipFile(path) as zf:
    members = {Path(name).name.lower(): name for name in zf.namelist()}
    for table in TABLES:
        filename = members.get(f"{table}.txt")
        with zf.open(filename) as raw:
            df = pd.read_csv(text, dtype=str, keep_default_na=False)
Python · Call a stop moved only after a 15 m shift
moved_m = round(haversine_m(
    float(lrow["stop_lat"]), float(lrow["stop_lon"]),
    float(rrow["stop_lat"]), float(rrow["stop_lon"]),
), 1)
if moved_m >= MOVE_THRESHOLD_M:  # 15 meters
    status = "moved"
Python · One compare function builds tables, counts, geo, and highlights
routes = _diff_routes(left, right, left_idx, right_idx)
stops = _diff_stops(left, right, left_idx, right_idx)
service = _diff_service(left_idx, right_idx, routes)
geo = _build_geo(left_idx, right_idx, routes, stops, service)
return {"left": left_meta, "right": right_meta,
"counts": counts, "tables": tables, "geo": geo}Analytics & Deliverables
- Local OSM map: Feed A dashed, Feed B solid, status-colored stops, and move lines
- Filterable tables for routes, stops, service, calendar, transfers, and fares
- Excel workbook with a summary sheet and status-colored entity sheets
- This page: the May vs August 2026 VIA snapshot, including the same workbook
May 2026: 89 routes, 6,097 stops, 14,589 trips, 358 shapes. August 2026: 88 routes, 6,096 stops, 14,665 trips, 361 shapes. Route 251 (Nogalitos / Kirk 51-62 Lineup) was removed. Routes 62 Kirk and 89 Poplar changed color and gained weekday trips. Calendar exception dates (14 added, 4 removed) are in the Excel file.
Loading VIA comparison…
Results & Impact
Operational outcomes
- A planner can see the dropped 251 lineup, 9 added / 10 removed / 3 moved stops, and 32 pattern or alignment edits without opening raw GTFS
- Route 62 weekday trips moved from 35 to 69 and route 89 from 33 to 62 — service changes that a geometry-only overlay would miss
- The August feed is the first of the pair to carry fare tables ($1.30, $2.60, $0.65, $0.00)
- Excel is the shareable artifact; the map is the overlay
Adoption
- Service planning feed review
- Scheduling / span checks
- GIS overlay of alignment changes
Lessons learned
- A GTFS zip is not a changelog — status plus a few well-chosen thresholds is the product.
- Keep feed selection out of the browser when the files already live on disk.
- Attribute diffs and service diffs have to travel together or a color change hides a trip-count change.
- Public agency feeds can be shown as published; the disclaimer is the date range, not a mask.