2026 · Case study
E-Commerce Analytics Engineering
Built and validated a PostgreSQL analytical warehouse for a simulated e-commerce business, then modernized the transformation layer with dbt while preserving exact business logic and outputs.
This case study uses a deterministic synthetic dataset for a simulated e-commerce business. Findings demonstrate analytics-engineering methodology; they are not real-market behavior.
Executive Summary
A simulated e-commerce business needed a trusted analytical foundation, not another dashboard on raw transactions. Orders, items, shipments, returns, and reviews sit at different grains and observation windows, so naive joins can multiply revenue and immature return windows can understate risk. I first built a tested PostgreSQL warehouse with conformed dimensions, foundational facts, and governed marts. I then modernized the transformation layer with dbt — sources, thin staging, reusable intermediates, tests, and generated lineage — while keeping the original warehouse as a control. The candidate was accepted only after exact side-by-side reconciliation. The dataset is deterministic and synthetic; this is a portfolio demonstration of analytics-engineering and migration discipline.
- Problem
- A simulated retailer needed a governed warehouse for sales, customer, product, retention, promotion, and fulfillment analysis — then a way to introduce dbt without drifting validated metrics or keys.
- Who
- A simulated merchandising, finance, and customer-analytics audience, plus technical reviewers of the migration.
- Solution
- Python generated and loaded 13 PostgreSQL source tables; SQL built a validated control warehouse; dbt reproduced staging, dimensions, facts, intermediates, and marts beside that control until outputs matched exactly.
- Outcome
- 37 dbt models, 215 dbt tests, 167 pytest tests, and 375 PostgreSQL quality checks passed, with zero control-versus-dbt differences across dimensions, facts, and marts.
Business Problem
Background
Raw transactional tables were not enough for reliable commercial, customer, product, promotion, fulfillment, and retention analysis. The first implementation solved that with PostgreSQL, SQL, and Python orchestration. The next problem was introducing dbt without changing validated metric definitions, surrogate keys, maturity rules, or analytical outputs.
Challenges
- Orders, items, payments, shipments, returns, and reviews have different grains and cannot be joined naively
- Percentages stored at one grain misstate results if they are averaged instead of recomputed from additive components
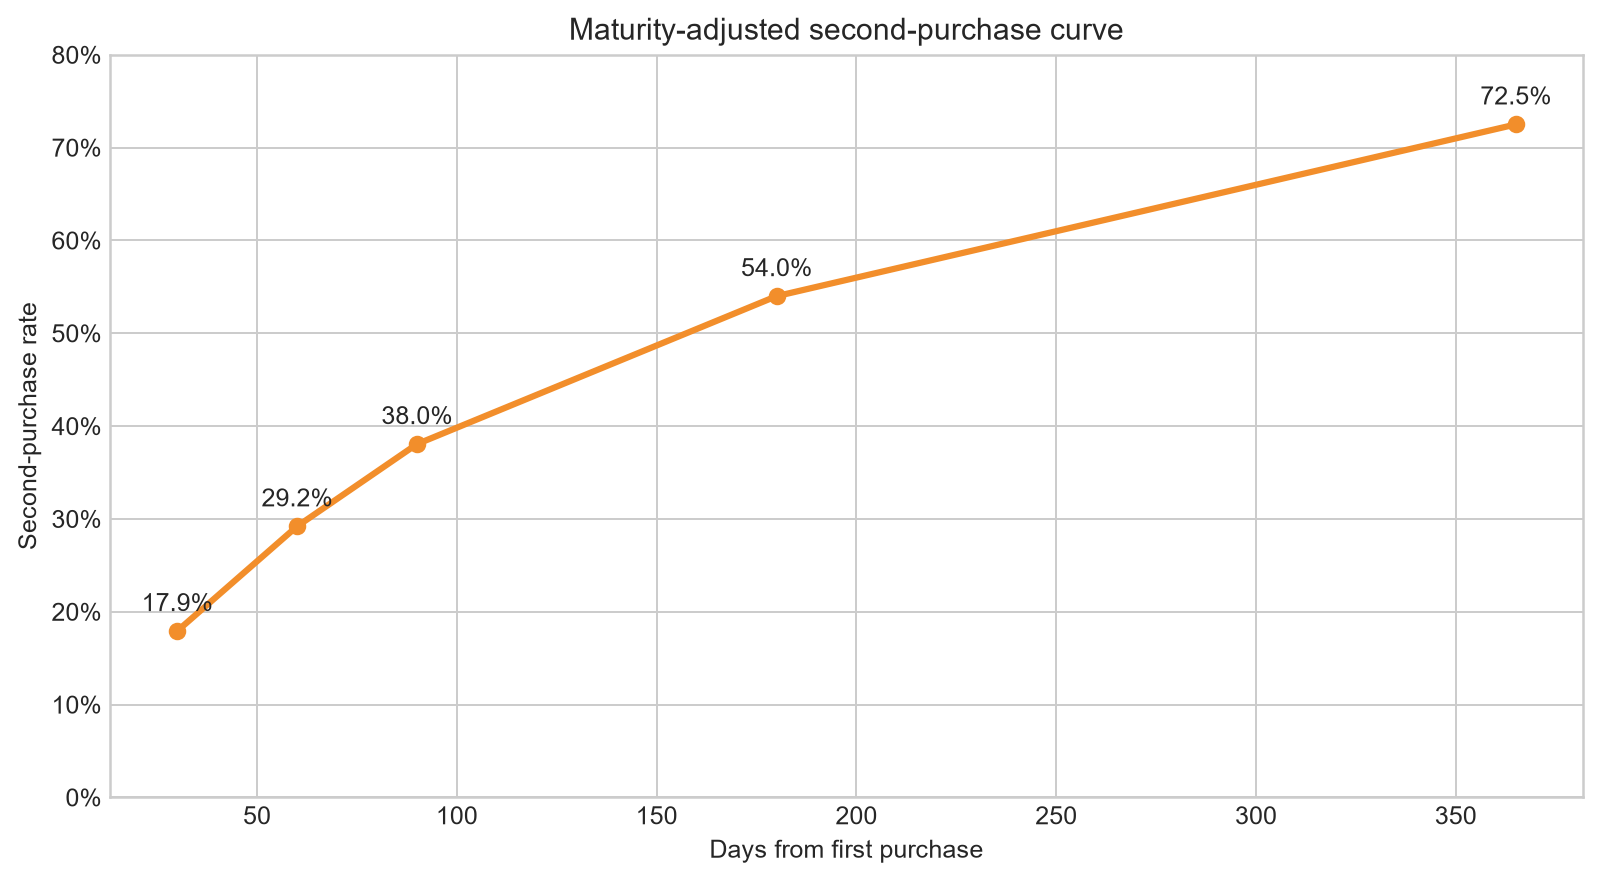
- Recent purchases have incomplete return opportunity; immature rates must stay null rather than look like zero risk
- Surrogate keys and Type 1 dimension behavior had to survive a transformation-layer rewrite
- dbt had to match the validated control exactly rather than replace it on trust
Stakeholders
- Simulated merchandising and finance users of sales, margin, and product marts
- Simulated customer-analytics users of RFM, cohort, and repeat-purchase views
- Analytics engineering reviewers of tests, lineage, and migration parity
Success criteria
- Governed marts for daily sales, product, customer, promotion, fulfillment, RFM, and cohorts
- Exact control-versus-dbt parity for dimensions, facts, and marts
- Passing dbt, pytest, and PostgreSQL data-quality suites on deterministic rebuilds
- Clear synthetic-data disclosure and no causal promotion or churn claims
Solution Architecture
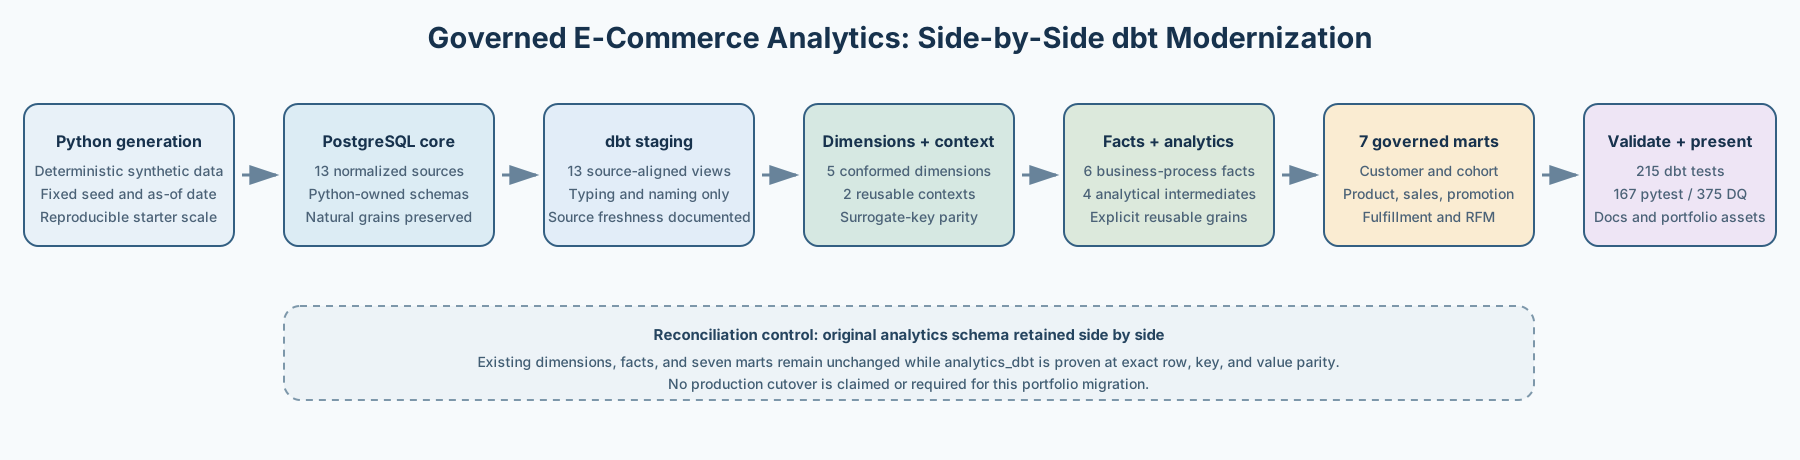
Data sources
- Deterministic Python generation into 13 PostgreSQL core tables (customers, products, orders, items, payments, shipments, returns, reviews, and reference data)
- Original analytics schema retained as the validated SQL/Python control
- dbt sources declared against core; candidate objects built in analytics_dbt schemas
Stack
Design decisions
Why keep the original warehouse? The SQL/Python analytics schema was already validated. dbt was accepted only after exact bidirectional row, key, type, and value parity — not after a leap-of-faith cutover.
Why thin staging? Staging views align names and types to the 13 sources. Business grain, surrogate keys, and metric contracts live downstream so lineage stays explicit.
Why marts instead of a dashboard-first design? Daily sales, customer RFM, cohorts, product months, promotion, and fulfillment needed reusable, tested definitions before any presentation layer. Power BI was not a completed core phase.
Data Modeling
Business metrics
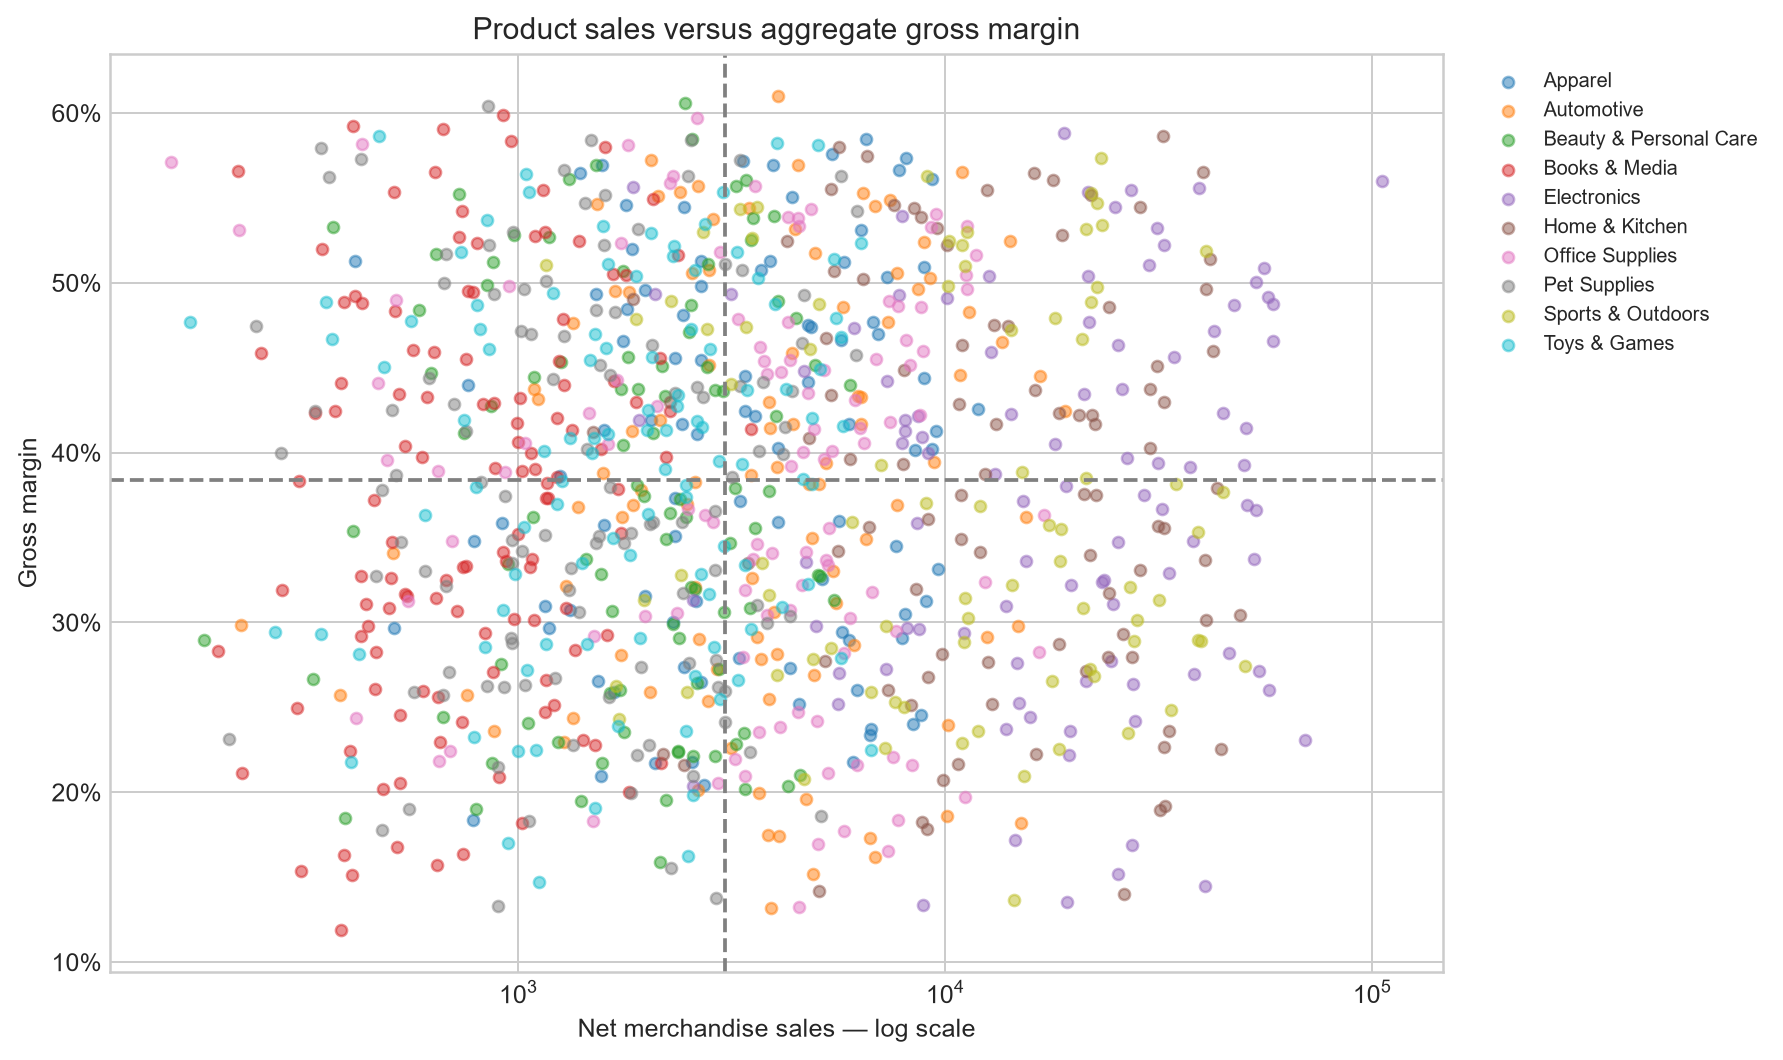
- Net merchandise sales
- Item net sales after discounts and before returns, tax, and shipping. Checkout totals, payments, and refunds are related but not interchangeable.
- Gross margin
- Gross profit divided by net merchandise sales, recomputed from additive components rather than averaged from stored percentages.
- Mature unit return rate
- Completed returned units over purchased units only after a full 45-day observation window; immature cohorts stay null, not zero.
- RFM segment
- Descriptive recency, frequency, and monetary labels as of a configured snapshot date. Not CLV and not a churn model.
Governance
- Successful activity means Completed plus Refunded orders
- Configured as-of date 2026-07-31; models do not use the system clock
- Promotion comparisons are observational, not lift or ROI
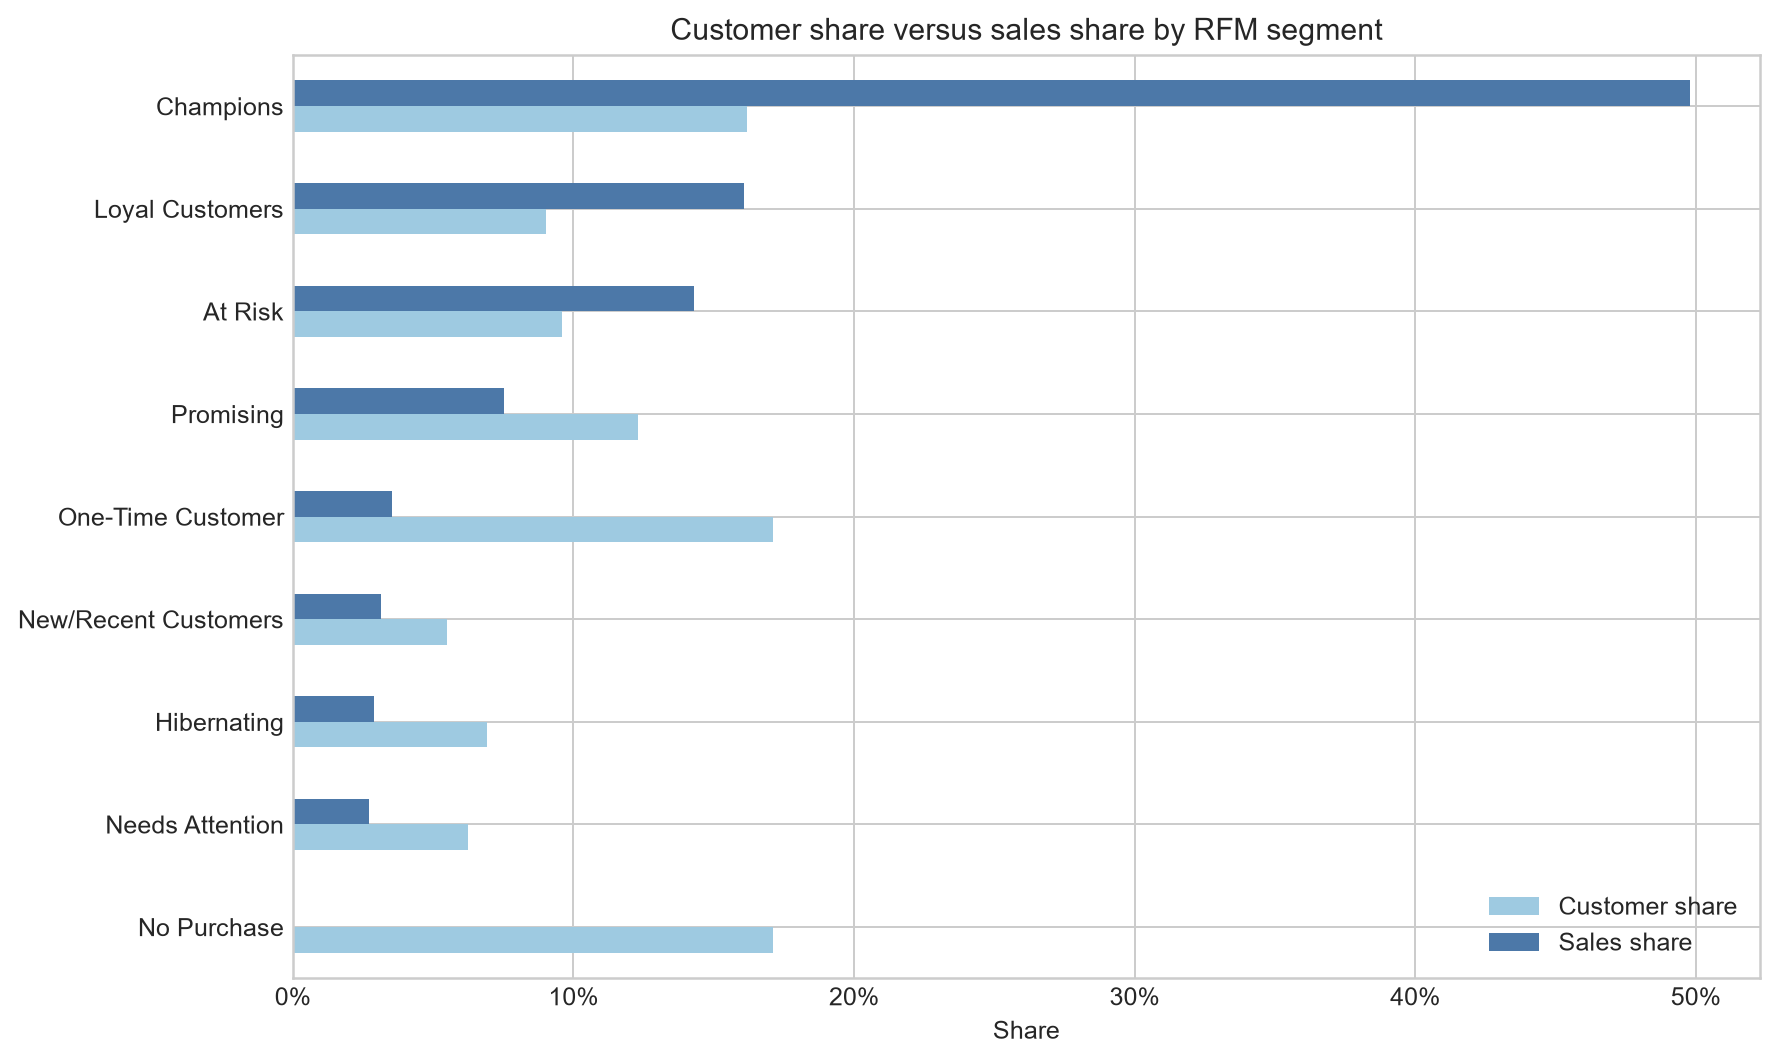
- Zero-purchase customers remain in customer and RFM marts as No Purchase
- The dataset is deterministic synthetic data at starter scale (5,000 customers, 1,000 products)
Technical highlights
A few modeling rules that kept the dbt migration honest against the original warehouse.
Governed metric definitions. Weighted rates are recomputed from additive components so a monthly margin is not an average of daily percentages.
Return maturity. Product return cohorts need a complete 45-day window. Incomplete windows stay null so recent volume cannot masquerade as low risk.
Stable surrogate keys. The dbt migration preserved identity-backed key mappings and Type 1 behavior instead of reallocating keys on rebuild.
Side-by-side migration. The original warehouse remained the control while dbt was developed, tested, and reconciled to exact parity.
Pipeline & Engineering
Ingestion
- Deterministic Python generation and load of 13 core PostgreSQL tables
- Fixed seed, source window, and as-of date so rebuilds are repeatable
- dbt source declarations against core; core is not a dbt-owned schema
Transformations
- 13 thin staging views, then five conformed dimensions and six foundational facts
- Six intermediate models for shared order, item, successful-activity, return, and review context
- Seven governed marts: daily sales, product monthly, customer summary, promotion monthly, fulfillment monthly, RFM, and cohort
Automation
- dbt build for models and 215 tests; pytest for 167 contracts; 375 PostgreSQL data-quality checks
- Controlled dimension bootstrap copies validated natural-ID to surrogate-key mappings, then durable sequences take over
- Generated dbt documentation and lineage; analysis notebooks stay read-only downstream of marts
SQL · Recompute gross margin from additive components
round(
    items.gross_profit / nullif(items.net_merchandise_sales, 0), 6
) as gross_margin_pct
SQL · Keep immature return rates null until the 45-day window closes
case when (
    (month_start_date + interval '1 month' - interval '1 day')::date
        + {{ var('return_maturity_days') }}
) <= '{{ var('as_of_date') }}'::date then round(
    coalesce(completed_returned_units, 0)::numeric
        / nullif(units_sold, 0), 6
) end as unit_return_rateAnalytics & Deliverables
- Governed marts for commercial, customer, product, promotion, fulfillment, RFM, and cohort analysis
- Phase 4 findings on value concentration, maturity-aware repeat purchase, and product economics
- Selected portfolio visuals below; Jupyter notebooks remain in the public repository
Headline figures use the documented starter-scale synthetic dataset. RFM is descriptive. Repeat-purchase association is not causality. Promotion analysis is observational.
Portfolio analysis · synthetic data
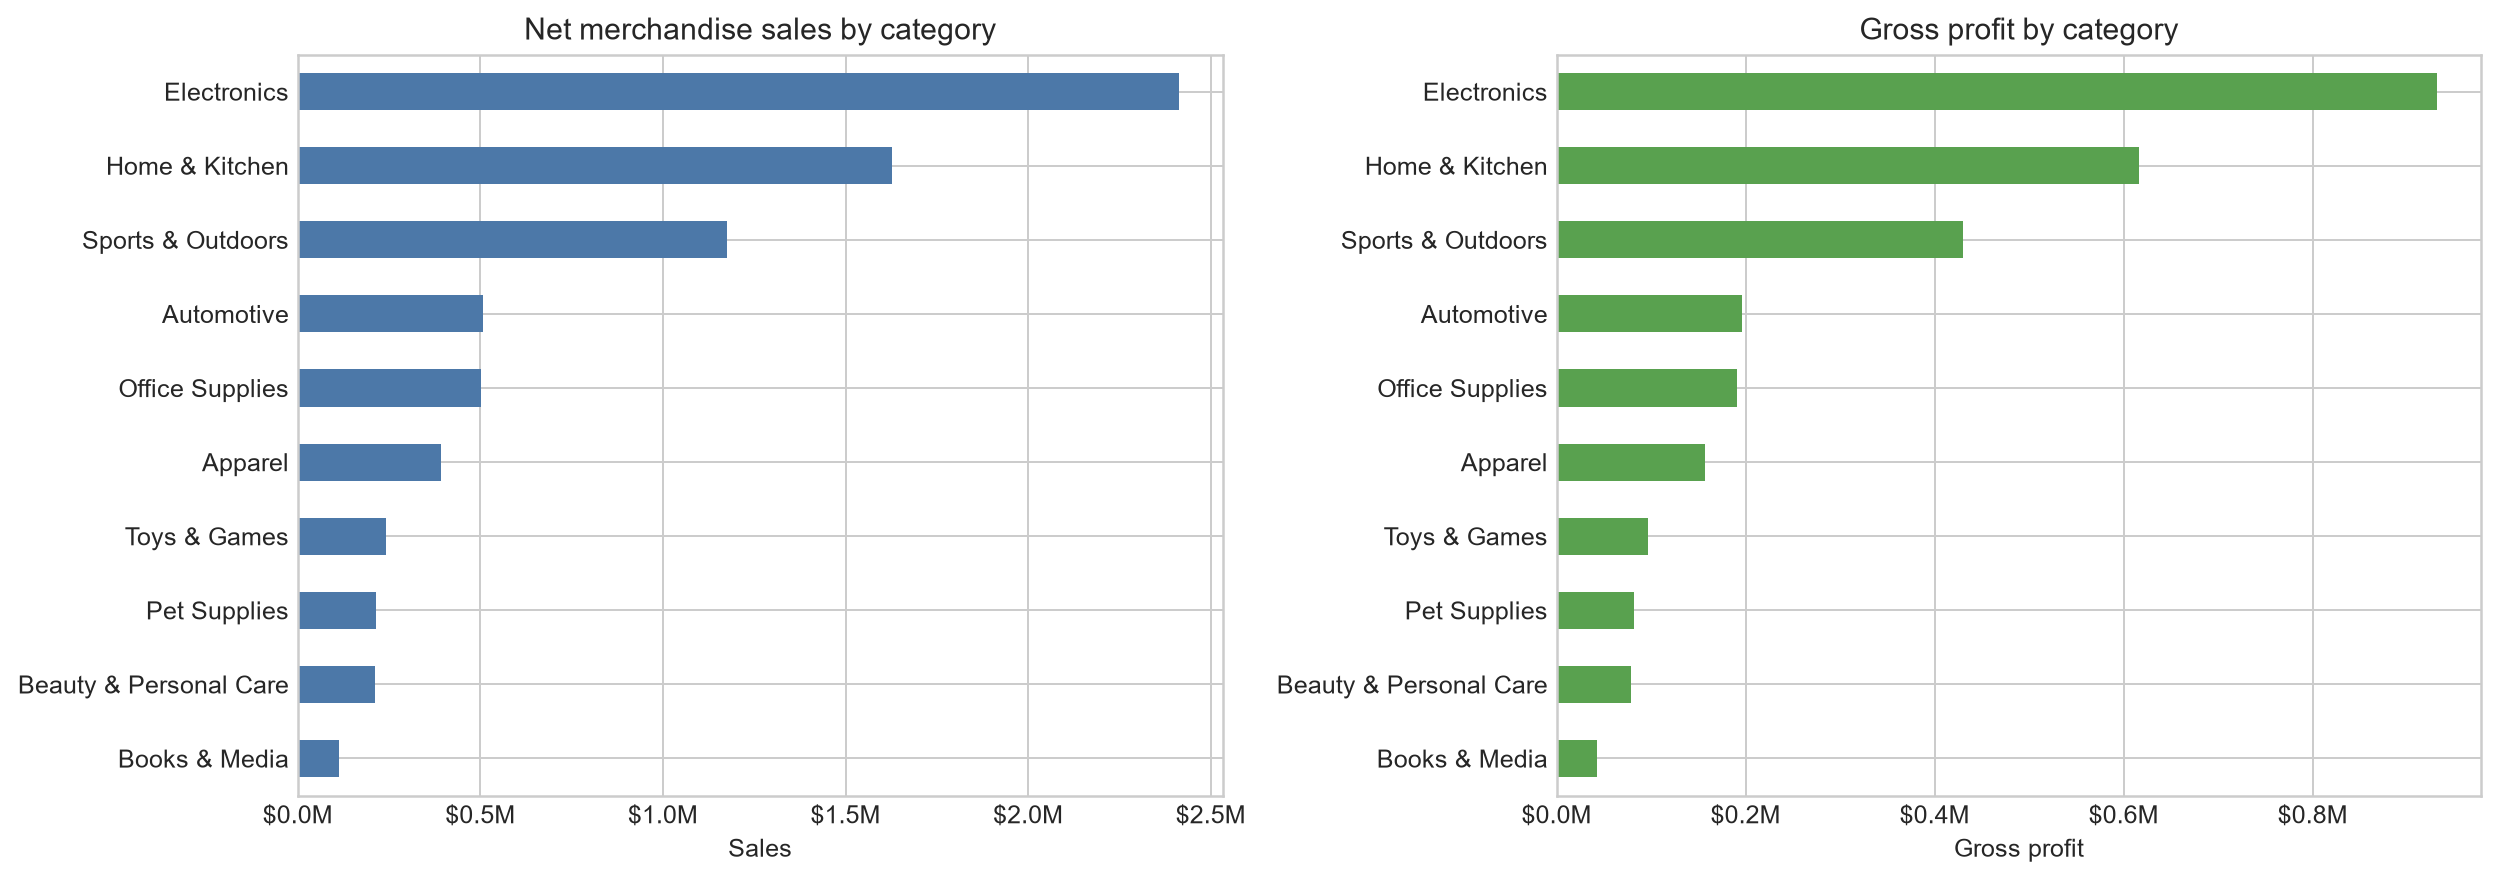
Selected analytical outcomes
Headline figures come from the documented starter-scale dataset: 23,596 successful orders, $7.394M net merchandise sales, 38.18% gross margin, and 5,000 simulated customers. They describe this warehouse, not a real company.
Exact side-by-side parity was achieved across all migrated dimensions, facts, and governed marts.
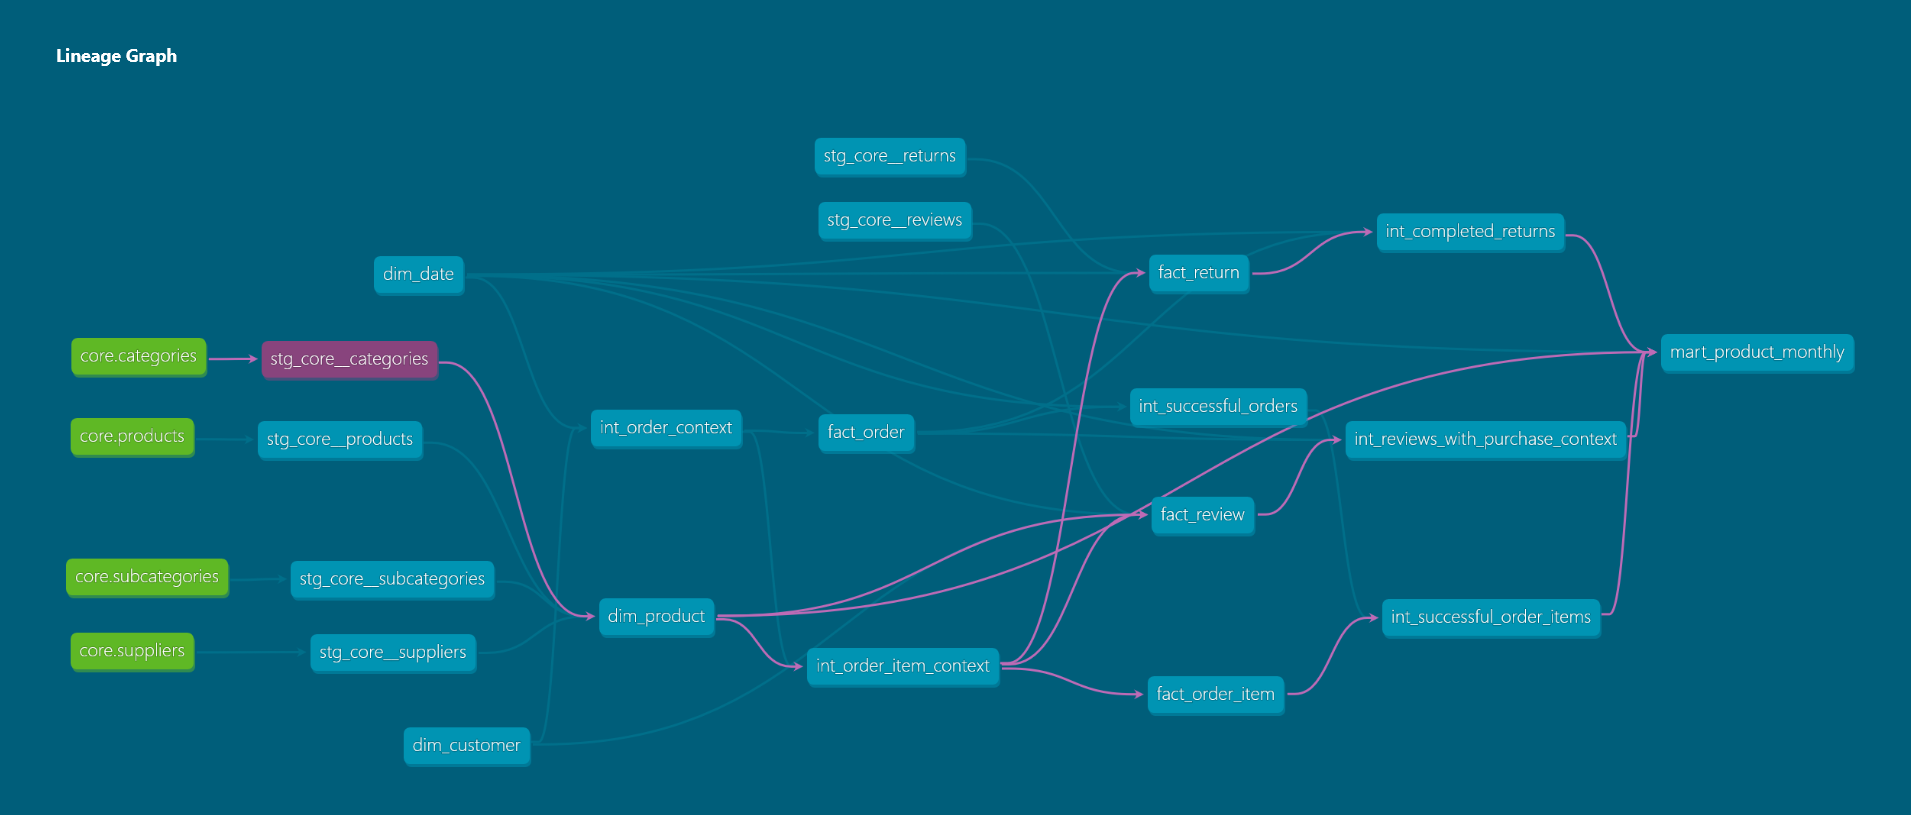
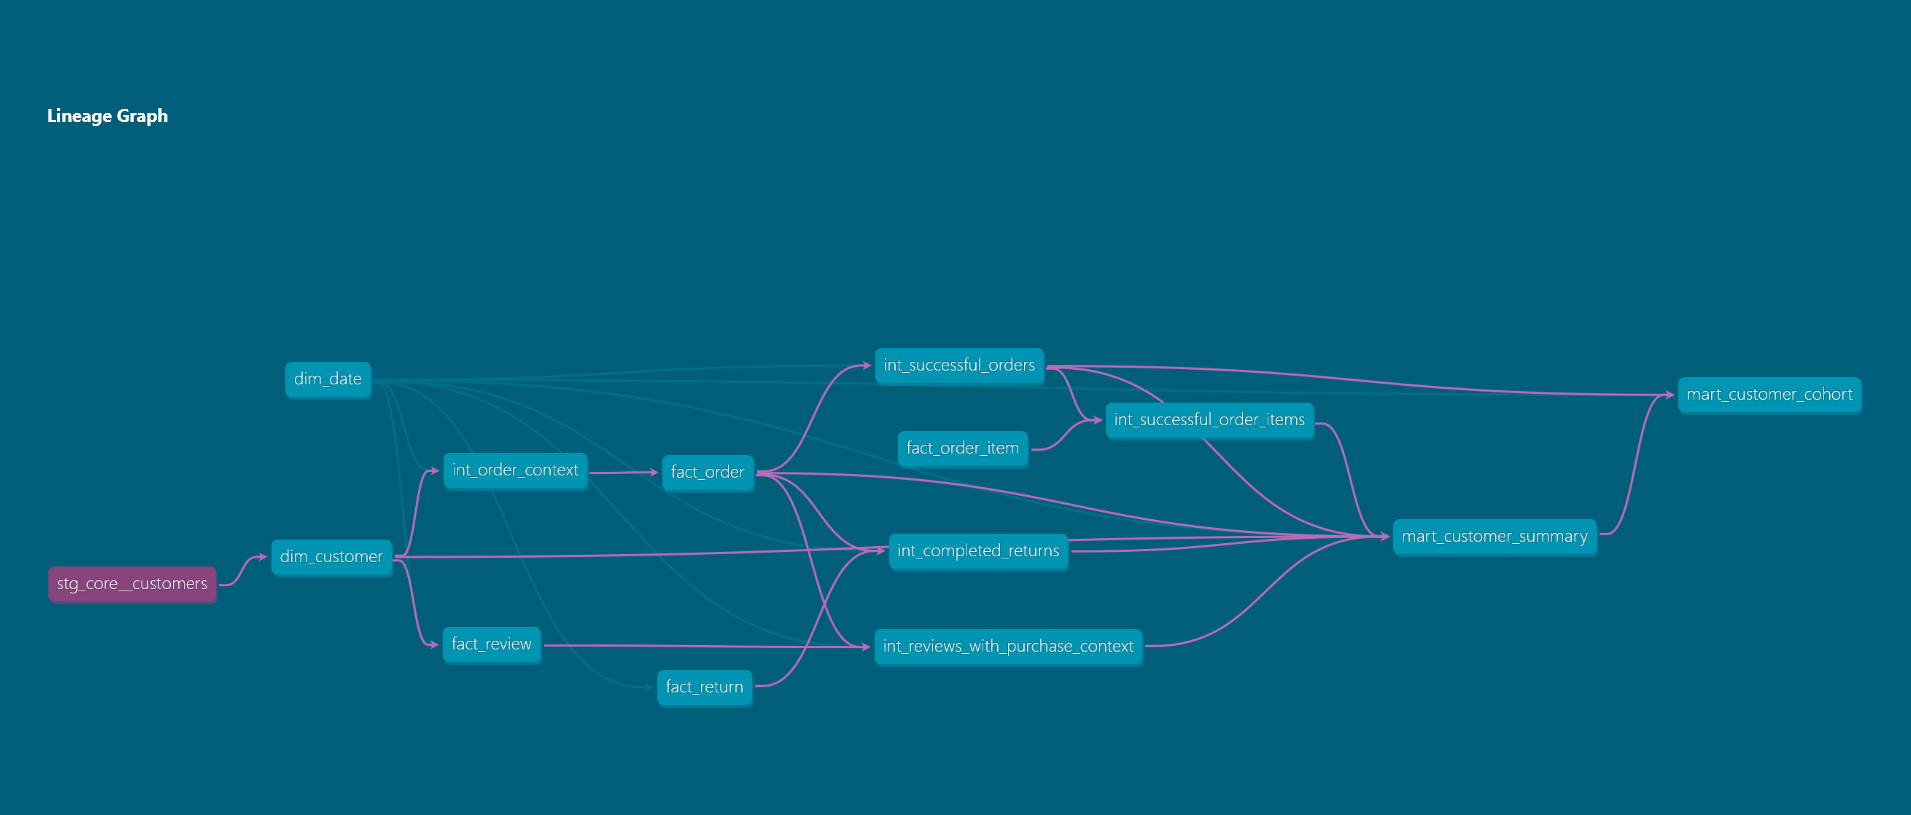
dbt lineage in practice
Representative dbt lineage views show how governed business logic moves from staged source data through dimensional and fact models into analytical marts.
Results & Impact
Operational outcomes
- 37 dbt models and 215 dbt tests passed on deterministic rebuilds
- 167 pytest tests and 375 PostgreSQL data-quality checks passed
- Exact control-versus-dbt parity across all migrated dimensions, facts, and governed marts — zero bidirectional row-level differences
- Surrogate-key mappings, types, precision, and null semantics preserved
Adoption
- Portfolio demonstration for analytics engineer, data/analytics engineer, senior analyst, and BI developer roles
- Public GitHub repository with dbt project, tests, and analysis notebooks
Lessons learned
- Migration discipline is the product: keep the validated warehouse as a control until parity is proven.
- Metric contracts belong in marts. Dashboards cannot repair averaged rates or immature return windows.
- A minority of customers and a few categories can dominate a synthetic commercial base; that is a modeling result, not market evidence.